Use the Query APIs to Unlock the Power of Azure Time Series Insights Part 3: The Predicate String

 By Basim Majeed, Cloud Solution Architect at Microsoft
This is the third part of the blog series which aims to clarify the query APIs of Azure Time Series Insights (TSI) by the use of examples. It is recommended that you visit the first and second parts of this series in order to learn more about how to set up the TSI environment and how to use Postman to replicate and modify the examples we show here.
In the example we are using here, the message sent by the simulated device is of the following JSON format:
{"tag":"Pres_22","telemetry":"Pressure","value":12.02848,"factory":"Factory_2","station":"Station_2"}
We also have two types of telemetry; Temperature and Pressure. The data represents a simple industrial environment with 2 factories, 2 stations per factory and 2 sensors for each station measuring Temperature and Pressure. For simplicity, all the data is channelled through one IoT device (iotDevice_1) connected to the to the IoT Hub, though you might want to have multiple devices connected directly to the Hub.
In this blog we focus on using the predicate string as a way to define our query predicate in a much more human readable and easy to understand way. In the first part of this blog series we discussed how the “predicate” clause provides a filter for our data so that we can do further analysis on the data that is of interest to us. The predicate string can be defined inside the “predicate” clause to do the filtering for us. For example, rather than defining the predicate as:
 "predicate":{
    "and":[
        {
            "eq": {
                "left": {
                    "property": "factory",
                    "type": "String"
                },
                "right": "Factory_1"
            }
        },
        {
            "eq": {
                "left": {
                    "property": "station",
                    "type": "String"
                },
                "right": "Station_1"
            }
        }
    ]
}
...one can use the following to achieve the same effect:
 "predicate":{
    "predicateString" : "factory.String='Factory_1'   AND station.String= 'Station_1'  "
}
The predicate string supports all the Times Series Insights data types (Bool, String, Double, DateTime and TimeSpan) and has a number of operations that can be used to compose complex data filters as described in the query syntax documentation. Unlike the JSON property reference expressions, a type for property can be omitted in which case a type is auto-resolved. Note that although the data type of the property can be resolved automatically, I do recommend that you specify it explicitly (e.g. String, Double, etc.) to avoid any ambiguity and to improve readability.
Now let us look at some examples in which we use the predicate string to get the data of interest and do some further analysis on it.
Example 1: Using the AND operator to combine filtering conditions
In this example we are using the predicate string to return all events from “Factory_1”, “Station_1” and telemetry type “Temperature”. The returned data is sorted by the default time stamp ($ts is the built-in time property), in ascending order (older events first) and we are setting a limit of 10 events to be returned in the query response.
 {
    "searchSpan": {
        "from": {"dateTime":"{{startdate}}"},
        "to": {"dateTime":"{{enddate}}"}
    },

    "predicate":{
    "predicateString": "factory.String='Factory_1' AND telemetry.String = 'Temperature' AND station.String= 'Station_1'"
    },
    "top" : {
        "sort" : [{
            "input" : {
                "builtInProperty" : "$ts"
            },
            "order" : "Asc"
        }],
        "count" : 10
    }
}
A partial view of the query results is shown in figure 1. We are not showing the schema details in this article as it was covered in detail in the first blog.
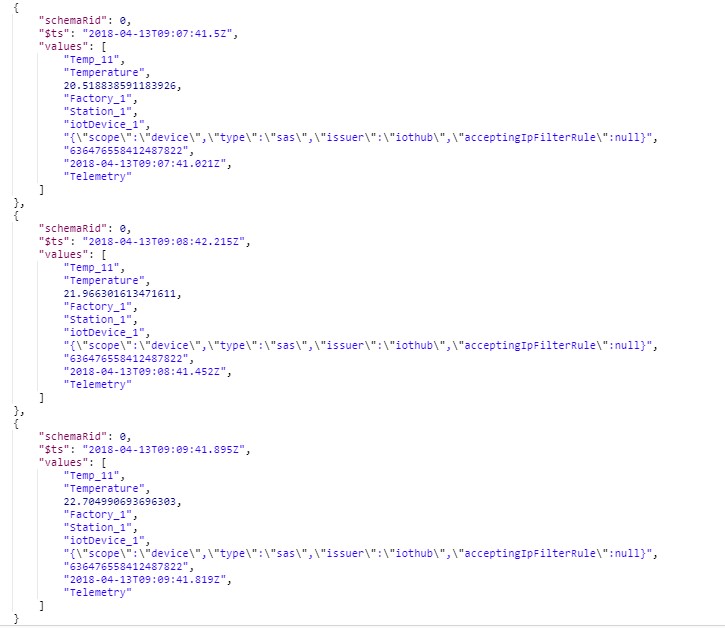
Figure 1: Partial results of Example 1
Example 2: Capturing telemetry alarm conditions
This example shows the “>” (greater than) operator to capture telemetry data that could be classified as alarm conditions. In addition, the “IN” operator is used to filter for properties that satisfy a set of categorical values.
 {
    "searchSpan": {
        "from": {"dateTime":"{{startdate}}"},
        "to": {"dateTime":"{{enddate}}"}
    },

    "predicate":{
    "predicateString": "tag.String IN ('Pres_11','Pres_12') AND value.Double>14.9"
    },
    "top" : {
        "sort" : [{
            "input" : {
            "builtInProperty" : "$ts"
        },
        "order" : "Asc"
    }],
    "count" : 10
    }
}
The results are shown in Figure 2:
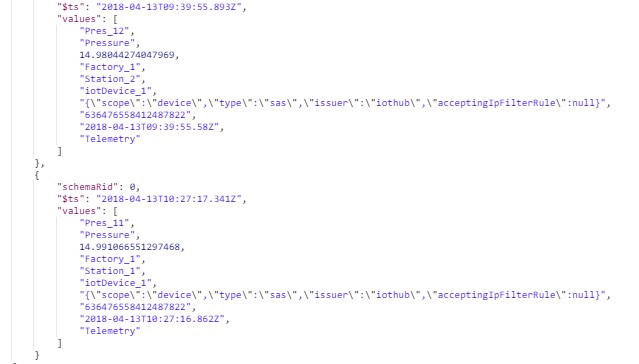
Figure 2: Partial results of Example 2
Example 3: Counting the occurrences of an alarm condition
Let us introduce a variation on example 2 by counting the number of occurrences of an alarm condition within the specified search span. Here we use a predicate string to identify the events matching the alarm condition (pressure measurements above a certain value), then we use the aggregates clause to count the occurrences of the alarm condition split by the sensor tag values (as specified in the “uniqueValues” clause). Note that we are restricting the number of sensors in the result to 2 in our example using the “take” clause.
 {
    "searchSpan": {
        "from": {
            "dateTime": "{{startdate}}"
        },
        "to": {
            "dateTime": "{{enddate}}"
        }
    },
    "predicate": {
    "predicateString": "telemetry.String='Pressure' AND value.Double>14.8"
    },
    "aggregates": [
        {
            "dimension": {
                "uniqueValues": {
                    "input": {
                        "property": "tag",
                        "type": "String"
                    },
                    "take": 2
                }
            },
            "measures": [
                {
                    "count": {}
                }
            ]
        }
    ]
}
The results are shown in Figure3 and they indicate that sensor “Pres_21” had 6 occurrences of the alarm condition while sensor “Pres_22” had 7.
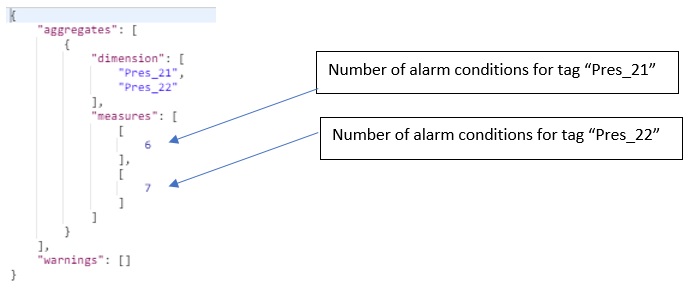
Figure 3: Using predicate string and aggregates clause to count the occurrences of alarm conditions
Example 4: Alarm condition histogram
Finally, instead of just counting the number of alarm conditions within the whole search span as we saw in example 3, we can use the date histogram together with the predicate string to calculate a time base histogram (time based histograms were covered in the second part of this blog series so we will not discuss their details here).
 {
    "searchSpan": {
        "from": { "dateTime":"{{startdate}}" },
        "to": { "dateTime":"{{enddate}}" }
    },
    "predicate":{
        "predicateString":"telemetry.String='Pressure' AND value.Double>14.8"
    },
    "aggregates": [
        {
            "dimension": {
                "uniqueValues": {
                    "input": { "property": "tag", "type": "String" },
                    "take": 2
                }
            },
            "aggregate": {
                "dimension": {
                    "dateHistogram": {
                        "input": { "builtInProperty": "$ts" },
                        "breaks": { "size": "20m" }
                    }
                },
                "measures": [
                    {
                        "count": {}
                    }
                ]
            }
        }
    ]
}
The results of this query are shown in Figure 4. Notice that there are 5 histogram buckets of 20 minutes each, and that the results contain the number of occurrences of the alarm condition (as specified by the query string) in each bucket and for each of the sensors returned in the result set. A null value indicates that there were no alarms within the bucket.
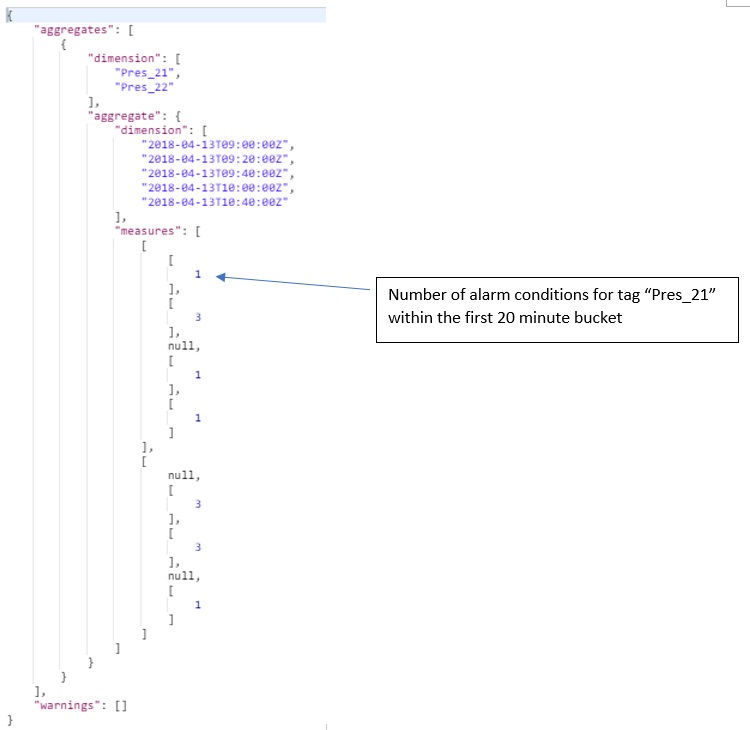
Figure 4: Using predicate string and aggregates clause to calculate the time based histogram of an alarm condition
Conclusion
In this final part of the blog series we explored the use of predicate strings to simplify the filtering process. Stay tuned for a new blog post to help you build custom visualisations of your Azure Time Series Insights data.