Part 2: Resource Governor CPU Demo on multiple CPUs
In some cases CPU demo described in the previous post may behave not as expected.
One such case is doing the demo on multiple CPUs. Even though it appears as Resource Governor is "not working", it is "by design". Let's take a look at what happens in this case.
What is our promise about CPU bandwidth distribution?
When you specify percentage on the pool we will ensure average CPU bandwidth distribution on per scheduler basis for CPU bound workloads. Note, emphasis: average, per scheduler, CPU bound. What does this mean?
For example, you have a 2 CPU machine, and SQL Server runs on both of the CPUs. If you haven't set affinity mask as was indicated in the Setup step of the previous post,
select scheduler_id, cpu_id, status, is_online from sys.dm_os_schedulers
will get you something like:
scheduler_id cpu_id status is_online
------------ ----------- ------------------------------------------------------------ ---------
0 0 VISIBLE ONLINE 1
1 1 VISIBLE ONLINE 1
257 0 HIDDEN ONLINE 1
255 0 VISIBLE ONLINE (DAC) 1
Important item to note here is that we have 2 online schedulers to service normal user requests (scheduler_id < 255). You can compare it with the case when affinity mask is set to 1. You will still have 2 schedulers (with scheduler_id < 255), but one of them will be offline.
Now, for simplicity, let's configure 2 groups and 2 pools as follows:
CREATE RESOURCE POOL pSlow
WITH (MAX_CPU_PERCENT = 30)
CREATE RESOURCE POOL pFast
WITH (MAX_CPU_PERCENT = 70)
CREATE WORKLOAD GROUP gSlow
USING pSlow
CREATE WORKLOAD GROUP gFast
USING pFast
GO
And corresponding classifier function as
CREATE FUNCTION f1()
RETURNS SYSNAME WITH SCHEMABINDING
BEGIN
DECLARE @val sysname
if 'UserSlow' = SUSER_SNAME()
SET @val = 'gSlow';
else if 'UserFast' = SUSER_SNAME()
SET @val = 'gFast';
return @val;
END
GO
Create logins, assign function and make changes effective
CREATE LOGIN UserFast WITH PASSWORD = 'UserFastPwd', CHECK_POLICY = OFF
CREATE LOGIN UserSlow WITH PASSWORD = 'UserSlowPwd', CHECK_POLICY = OFF
GO
ALTER RESOURCE GOVERNOR WITH (CLASSIFIER_FUNCTION = dbo.f1)
GO
ALTER RESOURCE GOVERNOR RECONFIGURE
Add group counters for CPU Usage % and run 1 CPU intensive query UserSlow, then 1 with UserFast. You will observe a picture similar to this:
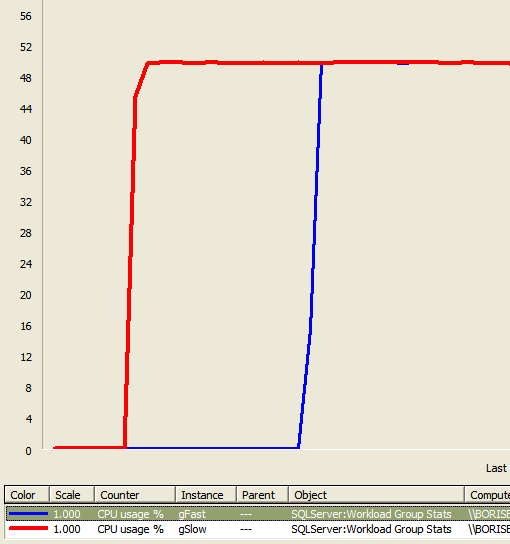
But how can explain that the resource governor does not obey 70:30 distribution we specified for the resource pools? The answer is quite simple: the queries landed on different schedulers (= different CPUs) and thus, there is nothing to share between them and each of them is taking a full CPU. How can you verify that?
First of all, verify the classification
-- verify the classification
select
sess.session_id, sess.group_id, CONVERT(NCHAR(20), grps.name) as group_name
from
sys.dm_exec_sessions as sess join
sys.dm_resource_governor_workload_groups as grps on sess.group_id = grps.group_id
where
session_id > 50
GO
Where you will see something like
session_id group_id group_name
---------- ----------- --------------------
52 2 default
51 265 gSlow
54 266 gFast
Everything is normal here. Now, let's take a look at how currently executing requests landed on schedulers:
select
r.session_id,
CONVERT(NCHAR(20), wg.name) as group_name,
t.scheduler_id,
r.status
from sys.dm_exec_requests r
join sys.dm_os_tasks t on r.task_address = t.task_address
join sys.dm_resource_governor_workload_groups wg on r.group_id = wg.group_id
where
r.session_id > 50
GO
Which will get
session_id group_name scheduler_id status
---------- -------------------- ------------ ------------------------------
54 gFast 0 runnable
52 default 0 running
51 gSlow 1 running
What you can see here is that gFast and gSlow is working on different schedulers, thus confirming our earlier statement. Thus Red and Blue line corresponds to utilization of 1 full CPU or 50%, since it is normalized to number of CPUs available on the box.
Is this a problem with Resource Governor in general? Certainly not if you have more executing requests than you have CPUs or if queries are running in parallel. But you should keep this in mind if you are trying to give 90% of CPU bandwidth to a single query running serially compared to a parallel query or number of serial queries in another group/pool.
A simple way of thinking about this is: is my workload capable of taking as much CPU as I told it to? Remember, when you set MAX_CPU_PERCENT on the pool, you allowing workloads belonging to the pool to take this much bandwidth on each scheduler. In case of the demo, you are working with a single query workload which produces this initially unexpected result.