Application Dependencies and Chained Events
The question seems to come often enough around application dependency discovery with AVIcode and or SCOM APM so it’s worth a quick discussion and walk through. First let’s define for the purpose of this discussion what we mean by application discovery and application dependency. This would then allow us to talk about how to use them for monitoring as well as application diagnostics. An application dependency is simply what does the application depend on from a .NET application resource point of view. For example does this application call a soap service or does it communicate to a database? These are application function calls to recourses and can be collected and reported fairly easily. Application discovery is a lot more complex discussion and in some circles called a black art. Also for the purpose of this discussion I will be referring to System Center 2012 Operations Manager APM. Outside of ASP.NET applications application discovery requires many things like permissions and application ‘finger prints’ for discovery to happen, Inside ASP.NET it is slightly easier to list what is installed in the IIS instance to run under what app pools.
So let’s first talk about application discovery in Operations Manager APM, specifically .NET applications. Before monitoring can happen we need to select an application to monitor. This selection is based on the list of applications discovered using the IIS 7.0 APM management pack in Operations Manager. Operations Manager can also allow you to discover applications of any type based on a custom management pack and custom discovery scripts, and some third party vendors have already created these for other applications. Once the discovery happens you can use the APM template wizard to create a template for application monitoring. This new template manages what application, where it is running and how we will alert and collect information from it. After applications are being monitored we will use the monitoring to collect events and performance counters. Events are made of exceptions in the code and functions performing slower than a set threshold.
Now the application dependency. This is a great diagnostics tool and even can be a great discovery tool for understanding the application. Using the monitoring that is running on the application we will listen for certain functions to be called. These functions are database calls and soap service calls. To us these are dependencies the application has. Now what do we do with these? First we treat them as resources inside of a collected event. So if a database is called inside of a poor performing web response it will be timed and counted even if it doesn’t break collection levels called sensitivity settings. See figure 1.
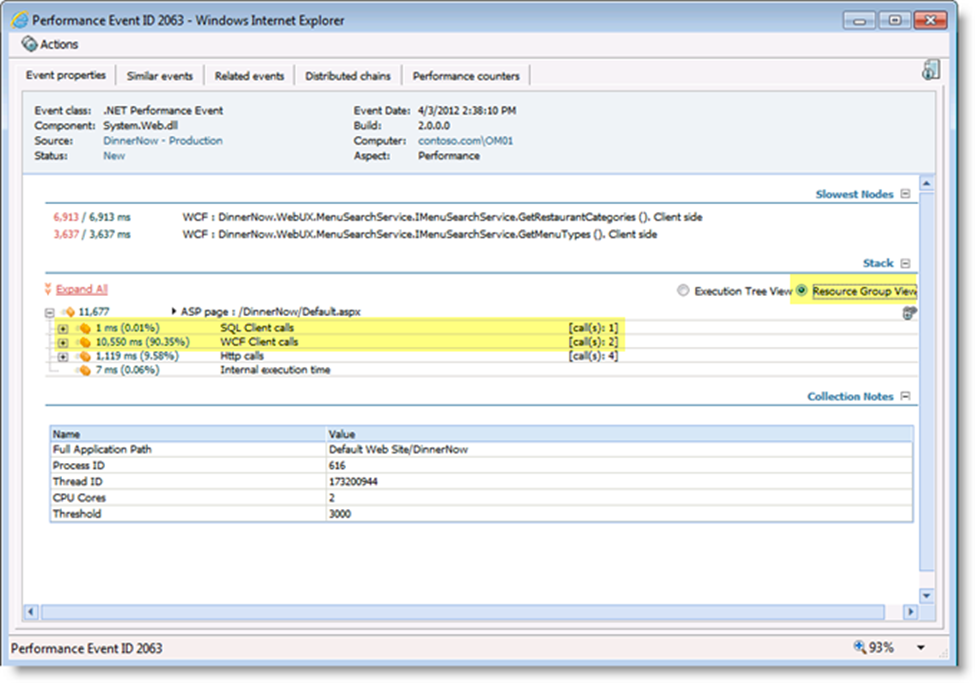
Figure 1
If they break the collection level called sensitivity level we then collect some additional detail about the call. See figure 2.
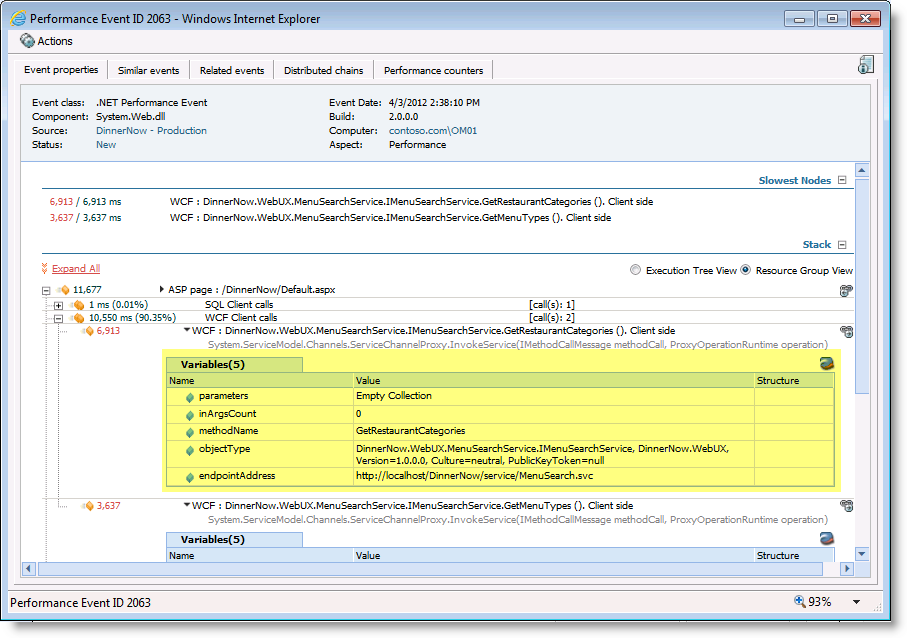
Figure 2
Now for some magic. Since we know the calls are happening and when we shouldn’t waste this knowledge. So let’s do 2 things with it. First let’s take the fact that a function call was made and register it somewhere so we know we depend on that resource, even if there is no event collected that the call is part of. Helps map and understand the application and is useful in diagnosing problems. For example if 10 databases and data servers are used and only one is consistently part of events we can assume a problem exist with that one and not the code that calls databases. See figure 3 for an example of dependency listing.
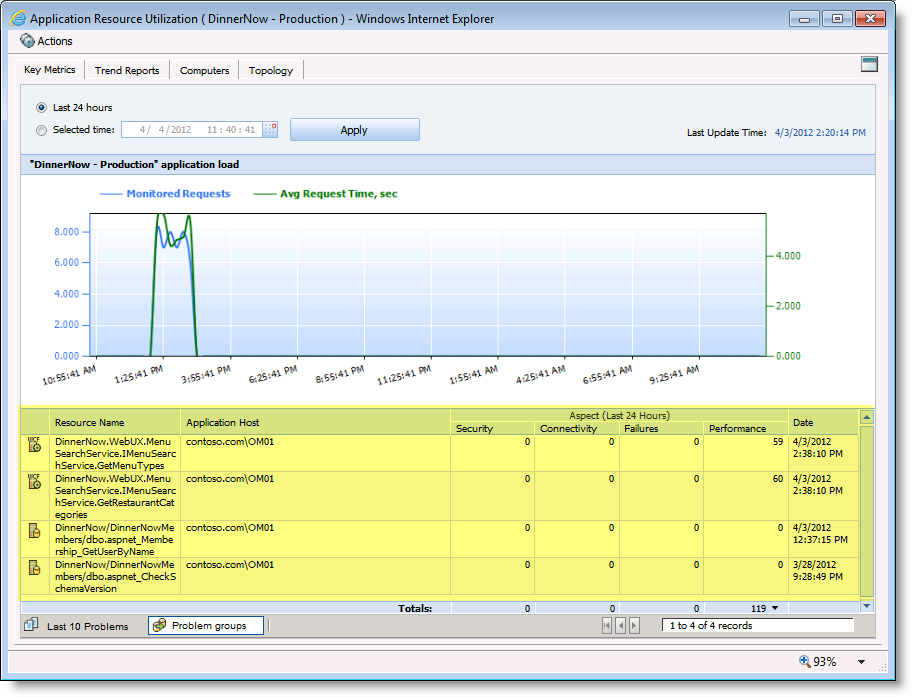
Figure 3
But what else can we do with this knowledge? This is a great question and a better answer. We can look at these function calls that make the calls to these dependencies and we can also look at function calls that are receive calls from dependencies in the event detail. When we see a ‘caller’ we can then look for events that could potentially be the ‘callee’ if we find something or bunches of multiples of something we can run a simple logical set of “if then” type statements against them to suggest they are related in some way. Well how could they relate? So if we monitor application ‘A’ and we see it calls a web service application ‘B’ which is also being monitored we may get events from both that either do or don’t correlate to each other. To confirm we see ‘A’ called at X time and date and waited Y time period with a set of parameters used, we then see that ‘B’ has an event similar in ‘X’, ‘Y’ and parameters maybe they are related. If we determine they are exactly related we can set this to a single transaction distributed chain and if not we can tell you these all are calls being made and show a multi transaction distributed chain. See figure 4 as the calling applications event details and it’s rendering in figure 5 of the single transaction distributed chain.
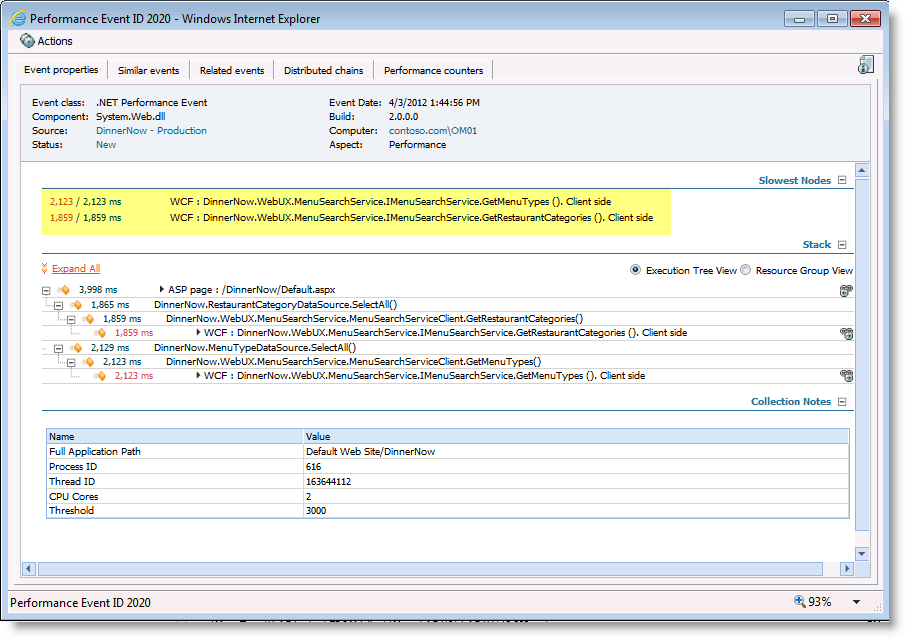
Figure 4
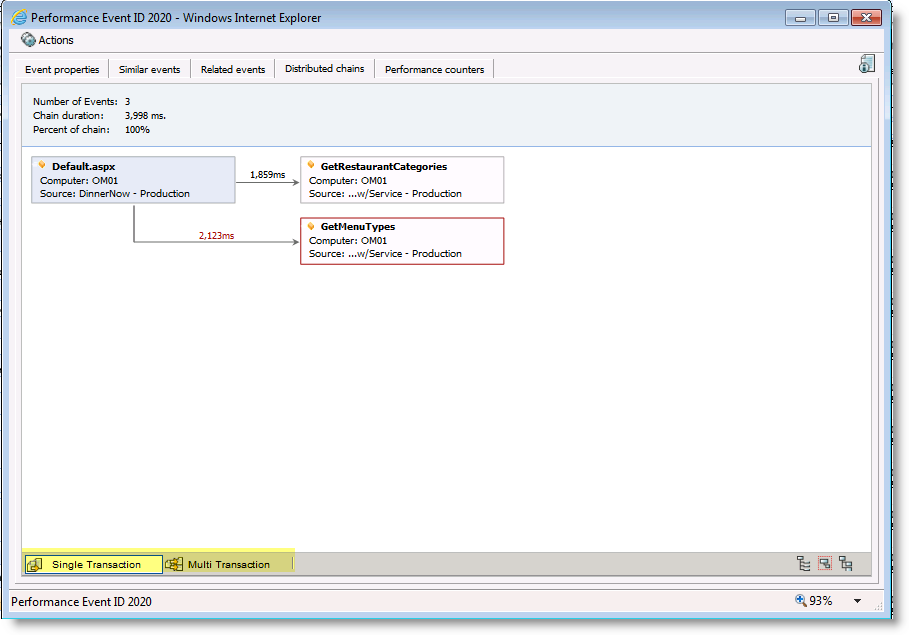
Figure 5