Monitoring SharePoint 2010 with Operations Manager 2012 APM
Can Operations Manager 2012 monitor Sharepoint 2010? I get this question on a weekly (if not daily) basis. The answer is yes and no. Yes, OM2012 can monitor server-side page execution in SharePoint 2010 environments. There are some default configuration limitations. We will explore how to do more advanced configuration in a future post. Client-side (browser) monitoring is not supported. In many cases, server-side monitoring will be enough to understand SharePoint health and performance. Let’s take a look at the level of information we can get by default.
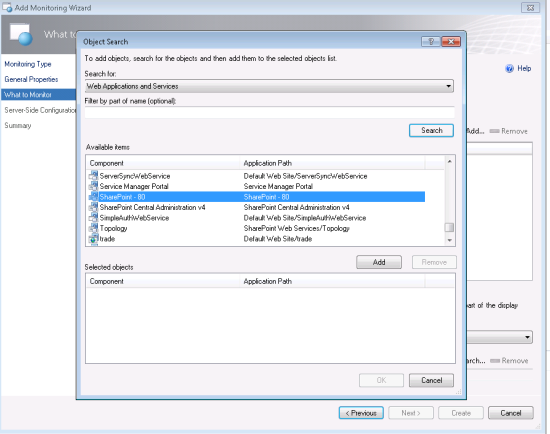
For this walkthrough, I’m using Operations Manager 2012 Release Candidate and a SharePoint 2010 environment. First, we need to make sure that OM is monitoring the SharePoint host. This will initiate the application discovery process. Under Authoring, we create a new Add Monitoring Wizard and Select .NET Application Performance Monitoring. After naming the template, we can search for Web Applications and Services. In my list, the ‘SharePoint -80’ instance has been discovered. We will add this to the selected objects list.
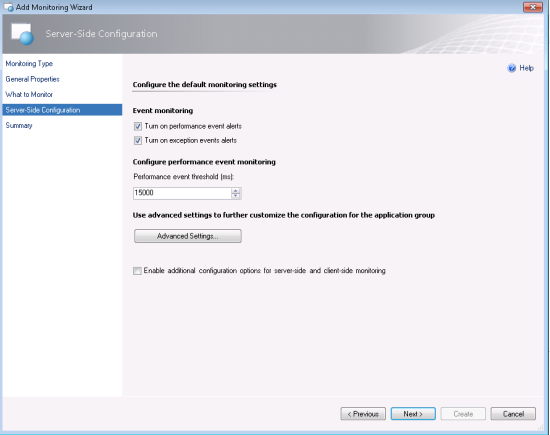
Next we need to specify the server-side settings we will use to monitor the SharePoint environment. In my test environment, I’m going to choose the default 15000ms. We can accept the defaults for the rest of the template and click create to generate a monitoring instance. Note: You will need to do an IIS reset on the target SharePoint server(s) in order for APM monitoring to start. Otherwise you will see the ‘Monitored Applications’ state as ‘Not Monitored’ in Operations Manager.
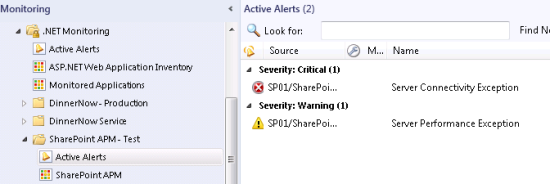
Once a restart has completed, we need to execute transactions in the SharePoint environment. In my test environment, I simply connect to the SharePoint home page. This page generally takes greater than 15000ms to load on first run (after a reset) and consequently I get performance alerts. You will need to make sure that you set your alerting threshold to a level that will generate alerts. Start with the default and reduce as necessary until alerts are raised.
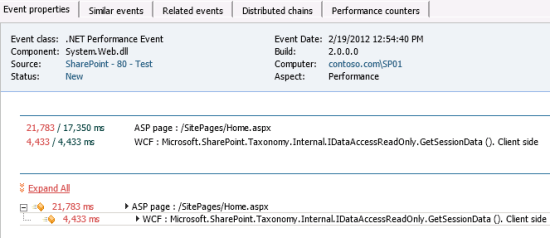
The performance alert description indicates that a “SitePages/Home.aspx” transaction has exceed the 15000ms thresold we defined. Clicking the included link brings us to the diagnostic detail.
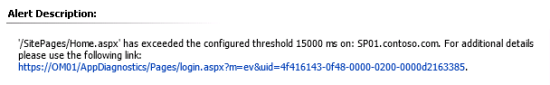
Inside the alert detail we can see the transaction took 21,783ms to execute. We can also see which server executed this request and the time it was executed. We can also see that 4,433ms of time was taken executing a WCF request.
I’ll dive into advanced configuration and how we can enable deeper visibility in an upcoming blog post. As you can see, with a few simple steps we are able to monitor SharePoint 2010 and provide application performance insight.
This posting is provided "AS IS" with no warranties, and confers no rights. Use of included utilities are subject to the terms specified at http://www.microsoft.com/info/copyright.htm.