Cordova Tools for Visual Studio Code
Three month ago I published a post about Tools for Apache Cordova for Mac developers. Thanks to the tools you can start developing your first Cordova project in couple minutes only. At the same time the tools didn’t provide any integration with Visual Studio Code and I could not use VS Code debugger in order to tune my applications. So, I was waiting for extensions and, suddenly, two weeks ago, I found that the extension is already available in the Marketplace.
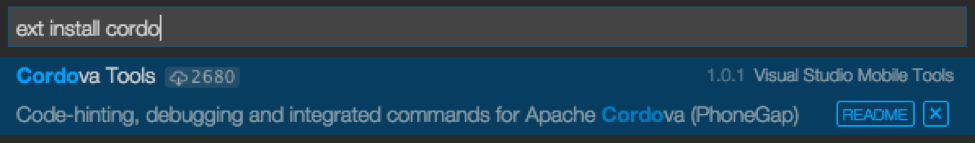
In order to install the extension, you can use the Command Palette window and execute install extension command and select Cordova Tools from the list:
But if you want to understand, how the extension works, I would recommend to open the GitHub repository there you can find source bits.
If you already have experience with extensions, you know that all configuration information is located in package.json. Looking at this file you can know all about the extension:
 "activationEvents": [
 "onLanguage:javascript",
 "onLanguage:typescript",
 "workspaceContains:config.xml"
],
"main": "./out/src/cordova",
"contributes": {
 "commands": [
 {
 "command": "cordova.build",
 "title": "Cordova: Build"
 },
 {
 "command": "cordova.run",
 "title": "Cordova: Run"
 },
 {
 "command": "cordova.prepare",
 "title": "Cordova: Prepare"
}],
"debuggers": [. . .]
So, you can see that extension will be activated once you open a JavaScript or TypeScript file. At the same time, project’s folder should contain config.xml. The last one contains settings of your application and should be available for all Cordova applications. The extensions supports several commands like Build and Run. Additionally, the extension supports own debugging service and integrates debugging features to VS Code. All information about available debuggers you can find inside debuggers element.
Finally, I would recommend to open src\cordova.ts. There you can find activation code itself:
 let watcher = vscode.workspace.createFileSystemWatcher('**/plugins/fetch.json', false /*ignoreCreateEvents*/, false /*ignoreChangeEvents*/, false /*ignoreDeleteEvents*/);

watcher.onDidChange((e: vscode.Uri) => updatePluginTypeDefinitions(cordovaProjectRoot));
watcher.onDidDelete((e: vscode.Uri) => updatePluginTypeDefinitions(cordovaProjectRoot));
watcher.onDidCreate((e: vscode.Uri) => updatePluginTypeDefinitions(cordovaProjectRoot));

context.subscriptions.push(watcher);

context.subscriptions.push(vscode.commands.registerCommand('cordova.prepare',
() => CordovaCommandHelper.executeCordovaCommand(cordovaProjectRoot, "prepare")));
context.subscriptions.push(vscode.commands.registerCommand('cordova.build',
() => CordovaCommandHelper.executeCordovaCommand(cordovaProjectRoot, "build")));
context.subscriptions.push(vscode.commands.registerCommand('cordova.run',
() => CordovaCommandHelper.executeCordovaCommand(cordovaProjectRoot, "run")));
So, nothing special – the method register all described commands and create a file watcher in order to check if you add or remove some plug-ins to your project. Information about plug-ins is important in order to add the right TypeScript definition files to your project. It will guarantee that IntelliSense system works fine.
So, the extension supports:
- Debugging features
- IntelliSense for plug-ins
- Several commands that allow to build and execute your application directly from Code
In order to use debugging features, you have to click Start button in Debug view and select Cordova from the list:

It will generate bunch configuration settings that you can use in order to start your applications on iOS/Android devices or their emulators:

Just select your favorite configuration and start debugging (make sure that you added iOS or/and Android platform to your project + for iOS development, use the recommendation from the extension page and install ios-webkit-debug-proxy: brew install ideviceinstaller iso-webkit-debug-proxy).
Enjoy!