Operations Manager 101: How Do I Generate a Top ‘n’ Performance Report?
Note this is part of a System Center 2016 – Operations Manager and Operations Management Suite (OMS) 101 Series: https://aka.ms/101
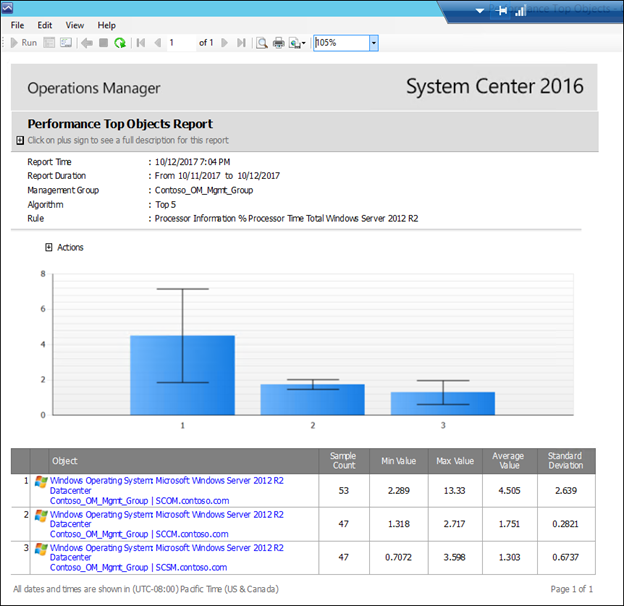
The Top 'n' reports are very powerful in that they can display the top 'n' server for CPU usage, memory or any performance counter being collected by Operations Manager and stored in the warehouse.
Instructions:
1) Open the Performance Top Objects Report
2) Click the reporting space and 'Microsoft Generic Reports Library' on the left
3) Double Click 'Performance Top Objects'
4) Click the Browse button next to 'Rule' and pick out the appropriate rule (if required this can be determined from the view created in Section G of this document)
5) Search for the appropriate rule name (e.g. for a report showing top 'n' objects for CPU usage, type processor and click 'Search'.
6) Choose the appropriate rule such as Processor Information % Processor Time Total Windows Server 2012 R2 and click ok.
7) Change the From and To fields to the desired timeframe.
8) Change the Algorithm from top N to Bottom N if appropriate for the counter being collected (e.g. if running against % free space, Bottom N may be more appropriate)
9) Change the 'n' to the appropriate number. By default this is 5 and will therefore show the top 5 / bottom 5 objects.
10) Click the Run button
NOTE: Any comments and feedback greatly appreciated if you found this post helpful or have any corrections / suggestions. Cheers, Antoni