Operations Manager 101: How do I create a rule to collect performance data that is not already collected in a management pack, and show it in the graphs in Operations Manager?
Note this is part of a System Center 2016 – Operations Manager and Operations Management Suite (OMS) 101 Series: https://aka.ms/101
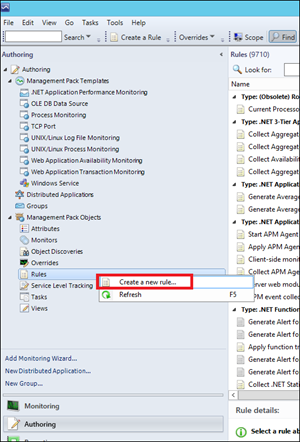
1) Navigate to the 'Authoring' Space of the console. Expand Management Pack Object and right-click Rules and choose 'Create a New Rule'
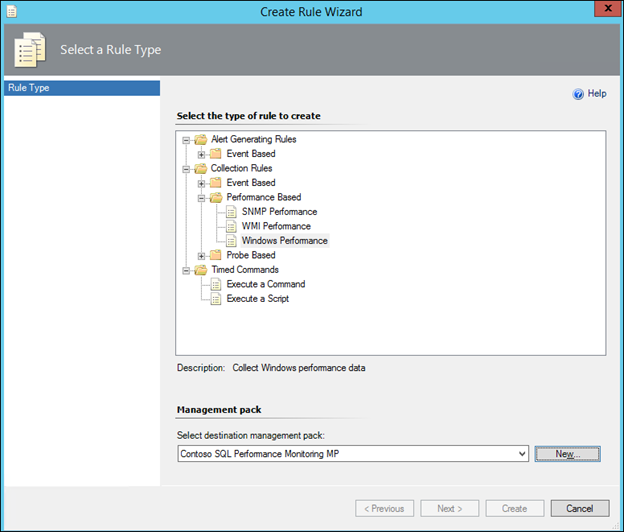
2) Select Collection Rules>Performance Based> Windows Performance, and change the management pack to something other than the Default Management Pack and click Next:
3) Give the rule a name (I recommend using a prefix to the rule name such as a 3-letter acronym of the company name as this makes it easier to find objects such as rules in the console), select a Rule Target that will be present on the computer you want to collect the performance counter from. In this case an appropriate target is SQL Server 2016 DB Engine, uncheck the 'Rule is Enabled' checkbox and then click Next:

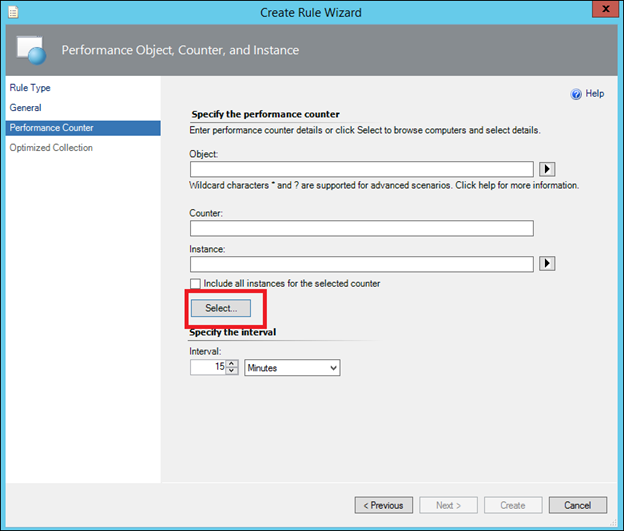
4) In the following dialog, ignore everything else and click the 'Select' button;
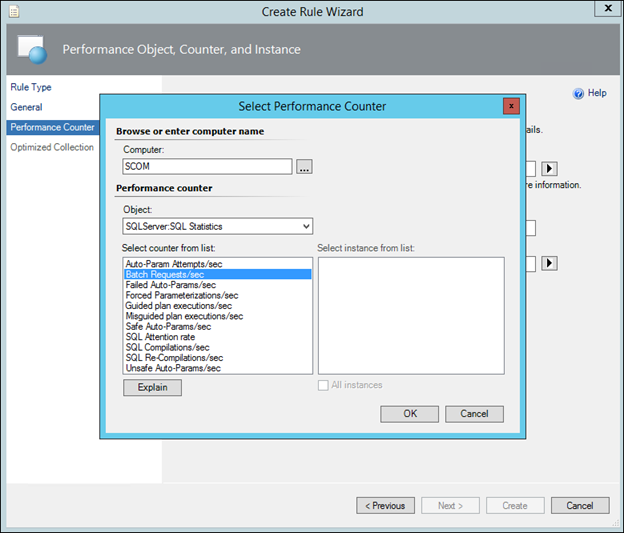
In computer, Browse to a computer that has the performance counter you need to collect and the available object and counters in the list will refresh.
NOTE: This is purely for picking the correct counter. By selecting a computer to pick the counter from, you are not saying 'I just want to target this one computer'. Because in the previous dialogs we selected SQL Server 2008 DB Engine as the Rule target, the performance counter rule will be activated on every Operations Manager agent where a SQL Server 2008 DB engine object is found.
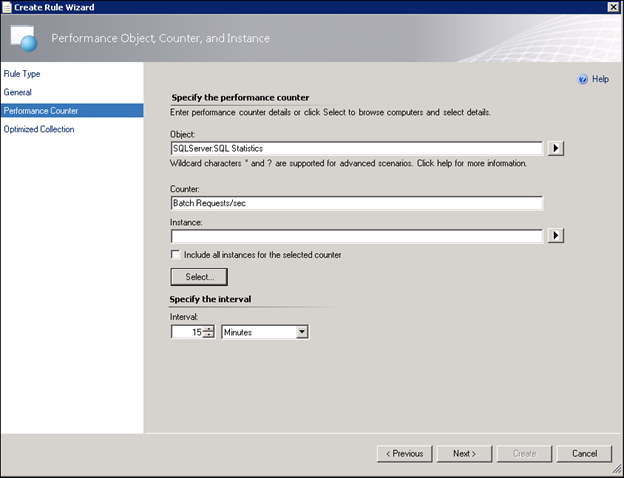
Pick the appropriate object and counter and click OK:
Configure the interval / instances as required and click Next:
Leave the defaults in the Performance Optimization dialog, and click Create:
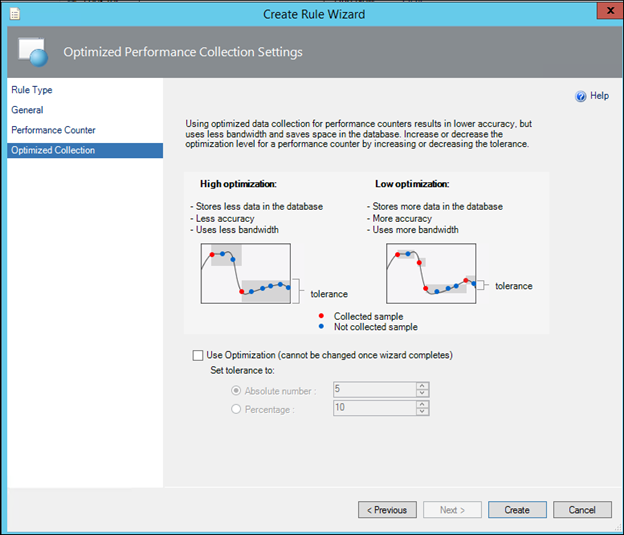
NOTE: Performance Optimization will drop consecutively collected samples that are within a specified range (based on absolute number or percentage) of the last sample collected. This is to reduce space in the database.
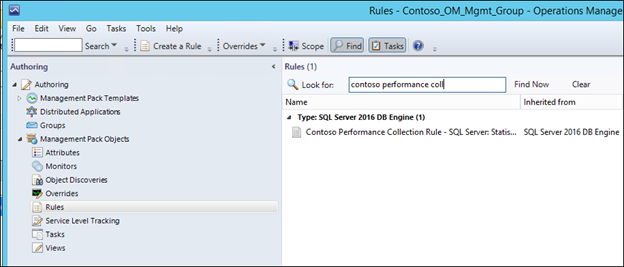
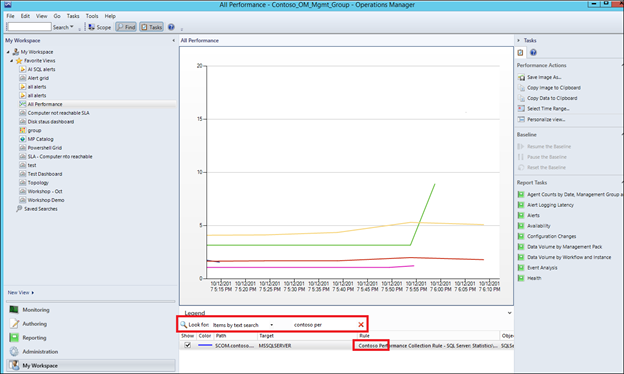
In Authoring>Rules use the 'Look for' box to find the rule that you just created:
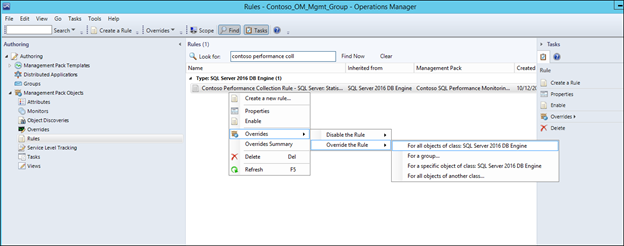
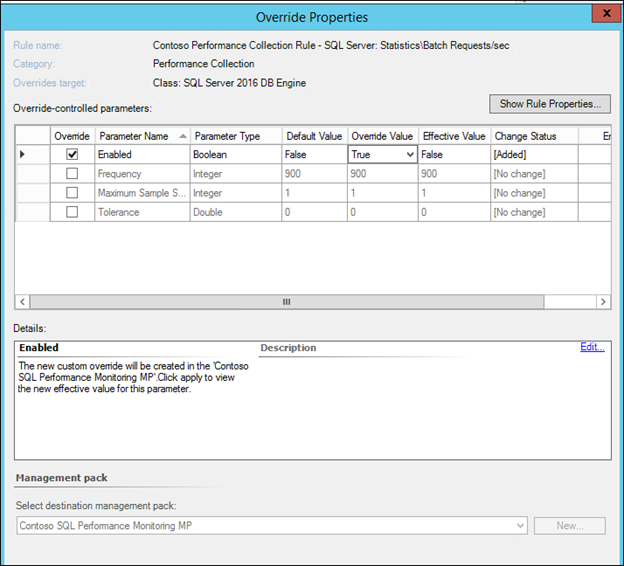
Override the Rule for all objects of class, for a group, for a specific object depending on your scenario (which of these you wish to turn the performance collection rule on for):
Place a check mark next to 'Enabled' and then change the override value from False to True, and then click OK to save the override:
After the collection interval that you specified has past, you will see the data in the all performance view that you created. Click on the 'Show' checkbox to display the data. Note you can click on the graph to show the value of the data, or use the 'Select Time Range' option to show a more granular range:
NOTE: The data shown above will go back 7 days by default (unless the settings in Administration>Settings>Database Grooming for performance data have been changed):
NOTE: Data older than 7 days can be shown in a report (see section X of this document). The rule by default will store the collected performance data in both the live database and the data warehouse.
NOTE: Any comments and feedback greatly appreciated if you found this post helpful or have any corrections / suggestions. Cheers, Antoni