How to create an Incident Dashboard using Excel in System Center 2012 SP1 - Service Manager (SCSM) 2012
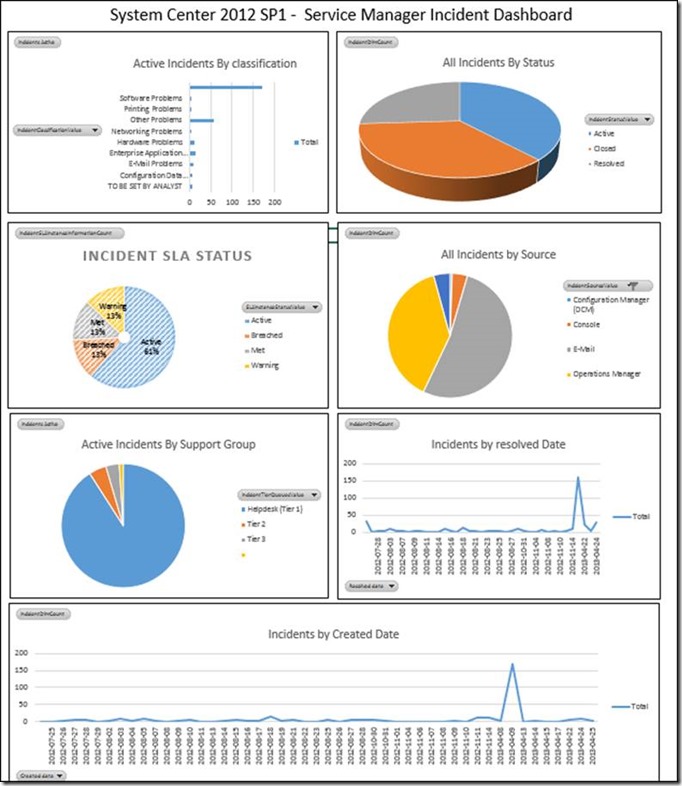
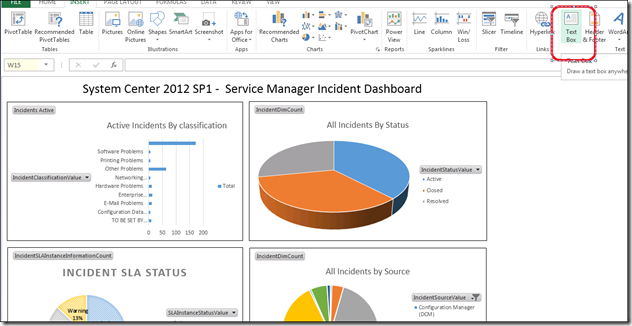
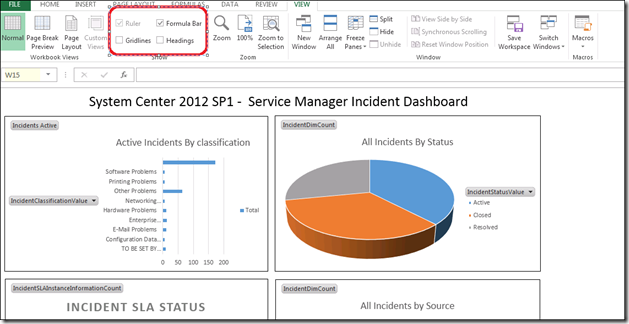
This blog walks through the steps needed to create a dashboard in Excel that looks like this:
HIGH-LEVEL STEPS:
1) From the Service Manager Console in the data Warehouse pane and the Cubes node, click on a cube and select ‘Analyze Cube in Excel’
2) Create multiple sheets in the excel workbook – each one with a PivotTable and chart
3) Create a new sheet in the excel workbook and copy and paste each of your charts from the sheets you created them on to the new ‘dashboard’ sheet
4) Publish by either storing it in a Service Manager ‘Analysis Library’ so it can be accessed via others by the console, or publish to SharePoint.
NOTE: You may need to add users (preferably via an AD group membership) to the SCDW_Report_Readers Role in SQL Analysis Services, and grant the role access to the cubes and data sources as described here so users have permissions to open up the report and refresh it:
DETAILED STEPS:
1) In the Service Manager console, navigate to Data Warehouse>Cubes and click Service Manager Work Items Cube, then click on ‘Analyze Cube in Excel’
2A) In the first excel sheet, create the ‘Active Incidents by Classification’ Report:
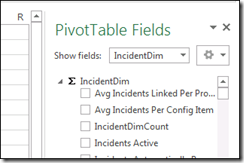
a) Under the PivotTable Fields pane on the right-hand side, Change the Show Fields dropdown on the right-hand side to IncidentDim:
b) Check ‘Incidents Active’

c) Scroll down to IncidentDim_IncidentClassification, expand ‘More Fields and check ‘IncidentClassificationValue’:

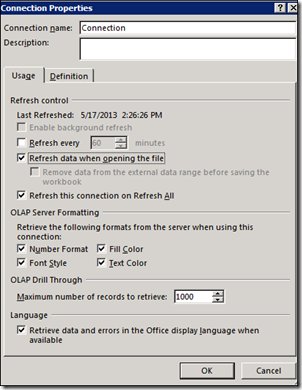
d) Click on the Data ribbon and then click the properties button. Ensure ‘Refresh data when opening the file’ is selected.
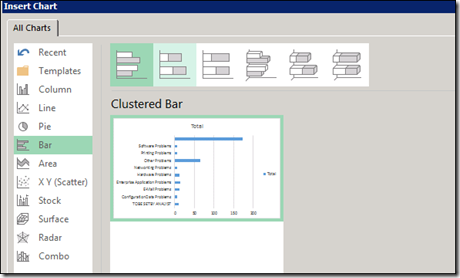
e) Click on the Pivot Table and then in the Ribbon click PivotTable Tools>ANALYZE and the PivotChart button
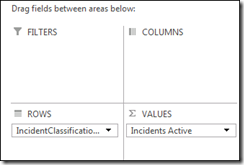
How the areas in the bottom right should be populated:
Filters – Blank
Legend – Blank
Rows - IncidentClassificationValue
Values – Incidents Active
so it looks like this:
2B) In a new Excel Sheet, Create the ‘All Incidents by Status’ report
a) Create a new worksheet and then click Insert, then choose PivotTable on the far left of the ribbon
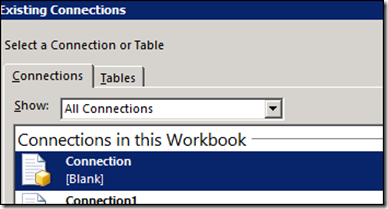
b) Check the ‘Use an external data source’ radio button and then click ‘choose connection’
c) Choose the Connection that has an icon with a cube on it and click open.
d) This will open up a new pivot table so you can create a second table selection and chart.
e) Under the PivotTable Fields pane on the right-hand side, Change the Show Fields dropdown on the right-hand side to IncidentDim
f) Check ‘IncidentDimCount’ (This is the total number of incidents in the Warehouse)
g) Scroll down to IncidentDim_IncidentStatus, expand ‘More Fields and check ‘IncidentStatusValue’
h) Click on the Data ribbon and then click the properties button. Ensure ‘Refresh data when opening the file’ is selected.
i) Click on the Pivot table and then in the Ribbon click PivotChartTools>analyze and the PivotChart button
j) Choose a Pie Chart.
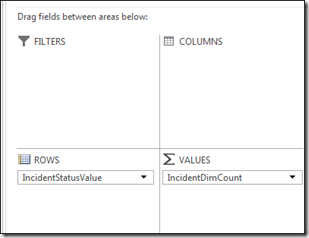
How the areas in the bottom right should be populated:
Filters – Blank
Legend – Blank
Axis - IncidentStatusValue
Values – IncidentDimCount
2C) In a new Excel Sheet, Create the ‘Incident SLA Status’ report
a) Create a new worksheet and then click Insert, then choose PivotTable on the far left of the ribbon
b) Check the ‘Use an external data source’ radio button and then click ‘choose connection’
c) Choose the Connection that has an icon with a cube on it and click open.
d) This will open up a new pivot table so you can create a second table selection and chart.
e) Under the PivotTable Fields pane on the right-hand side, Change the Show Fields dropdown on the right-hand side to Incident SLA Instance Information
f) Check ‘IncidentSLAInstanceInformation’ at the top
g) Scroll down to SLAInstanceStatus, expand ‘More Fields and check ‘SLAInstanceStatusValue’
h) Click on the Data ribbon and then click the properties button. Ensure ‘Refresh data when opening the file’ is selected.
i) Click on the Pivot table and then in the Ribbon click PivotChartTools>analyze and the PivotChart button
j) Choose a Pie chart .
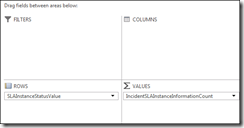
How the areas in the bottom right should be populated:
Filters – Blank
Legend– Blank
Rows- SLAInstanceStatusValue
Values – IncidentSLAInstanceInformation
2D) In a new Excel Sheet, Create the ‘All Incidents by Source’ report
a) Create a new worksheet and then click Insert, then choose PivotTable on the far left of the ribbon
b) Check the ‘Use an external data source’ radio button and then click ‘choose connection’
c) Choose the Connection that has an icon with a cube on it and click open.
d) This will open up a new pivot table so you can create a second table selection and chart
e) Under the PivotTable Fields pane on the right-hand side, Change the Show Fields dropdown on the right-hand side to IncidentDim
f) Check ‘IncidentDimCount’ (This is the total number of incidents in the Warehouse)
g) Scroll down to IncidentDim_IncidentSource, expand ‘More Fields and check ‘IncidentSourceValue’
h) Click on the Data ribbon and then click the properties button. Ensure ‘Refresh data when opening the file’ is selected.
i) Click on the Pivot table and then in the Ribbon click PivotChartTools>analyze and the PivotChart button
j) Choose a Pie chart.
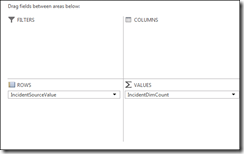
How the areas in the bottom right should be populated:
Filters – Blank
Rows– Blank
Axis - IncidentSourceValue
Values – IncidentDimCount
2E) In a new Excel Sheet, Create the ‘Active Incidents by Support group’ report
a) Create a new worksheet and then click Insert, then choose PivotTable on the far left of the ribbon
b) Check the ‘Use an external data source’ radio button and then click ‘choose connection’
c) Choose the Connection that has an icon with a cube on it and click open.
d) This will open up a new pivot table so you can create a second table selection and chart
e) Under the PivotTable Fields pane on the right-hand side, Change the Show Fields dropdown on the right-hand side to IncidentDim
f) Check ‘Incidents Active ’ (This is the total number of Active incidents in the Warehouse)
g) Scroll down to IncidentDim_IncidentTierQueues, expand ‘More Fields and check ‘IncidentTierQueuesValue’
h) Click on the Data ribbon and then click the properties button. Ensure ‘Refresh data when opening the file’ is selected.
i) Click on the Pivot table and then in the Ribbon click PivotChartTools>analyze and the PivotChart button
j) Choose a Pie chart.
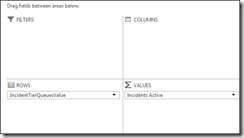
How the areas in the bottom right should be populated:
Filters – Blank
Legend – Blank
Rows - IncidentTierQueuesValue
Values – Incidents Active
2F) In a new Excel Sheet, Create the ‘Incidents by resolved Date’ report
a) Create a new worksheet and then click Insert, then choose PivotTable on the far left of the ribbon
b) Check the ‘Use an external data source’ radio button and then click ‘choose connection’
c) Choose the Connection that has an icon with a cube on it and click open.
d) This will open up a new pivot table so you can create a second table selection and chart
e) Under the PivotTable Fields pane on the right-hand side, Change the Show Fields dropdown on the right-hand side to IncidentDim
f) Check ‘IncidentDimCount’ (This is the total number of incidents in the Warehouse)
g) Scroll down to IncidentDim, expand ‘More Fields and check ‘Resolved date’
h) Click on the Data ribbon and then click the properties button. Ensure ‘Refresh data when opening the file’ is selected.
i) Click on the Pivot table and then in the Ribbon click PivotChartTools>analyze and the PivotChart button
j) Choose a Line
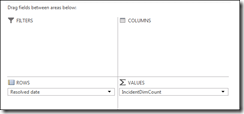
how the areas in the bottom right should be populated:
Filters – blank
Legend – blank
Rows - Resolved Date
Values – IncidentDimCount
2G) In a new Excel Sheet, Create the ‘Incidents By Created Date’ report
a) Create a new worksheet and then click Insert, then choose PivotTable on the far left of the ribbon
b) Check the ‘Use an external data source’ radio button and then click ‘choose connection’
c) Choose the Connection that has an icon with a cube on it and click open.
d) This will open up a new pivot table so you can create a second table selection and chart
e) Under the PivotTable Fields pane on the right-hand side, Change the Show Fields dropdown on the right-hand side to IncidentDim
f) Check ‘IncidentDimCount’ (This is the total number of incidents in the Warehouse)
g) Scroll down to IncidentDim, expand ‘More Fields and check ‘Created date’
h) Click on the Data ribbon and then click the properties button. Ensure ‘Refresh data when opening the file’ is selected.
i) Click on the Pivot table and then in the Ribbon click PivotChartTools>analyze and the PivotChart button
j) Choose a Line
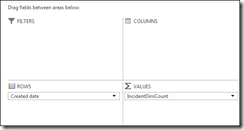
How the areas in the bottom right should be populated:
Filters – blank
Legend – blank
Rows - Created Date
Values – IncidentDimCount
3) On a new Excel Sheet, Create the dashboard
a) Create a new worksheet and rename it at the bottom left to ‘dashboard’
b) Copy and paste your charts form the other sheets to this worksheet.
c) Click the ‘View’ ribbon and uncheck formula bar, gridlines, and headings.
d) Click the ‘insert’ ribbon and choose textbox, and type a title such as Incident Dashboard at the top.
4) Publish by either storing it in a Service Manager ‘Analysis Library’ so it can be accessed via others by the console, or publish to SharePoint.
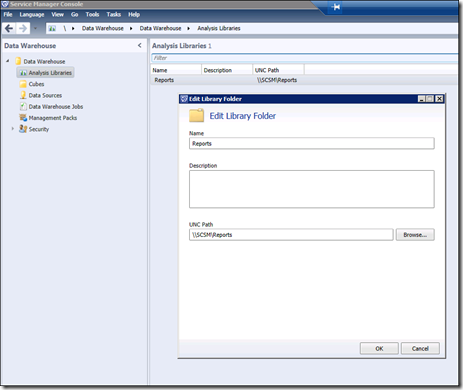
To use the Analysis Library, Create a share where you want to store reports and then specify this share in the Service Manager console underneath data Warehouse>Analysis Library:
Ensure that the Users who will be opening up reports on this share have access to it .
REPEATED NOTE: You may need to add users (preferably via an AD group membership) to the SCDW_Report_Readers and grant the role access to the cubes and data sources as described here so they have permissions to open up the report and refresh it:
ADDITIONAL REFERENCES:
This is a great blog post that talks about publishing to SharePoint using Excel web services: https://blog.scsmfaq.ch/2012/02/06/data-cubes-in-service-manager-2012-part-23-publishing-reports/
MMS 2013 - Advanced Real World System Center Data Warehouse and Reporting: https://channel9.msdn.com/Events/MMS/2013/SD-B316
Service Manager 2012: System Center Data Warehouse, Reporting, and Dashboards https://channel9.msdn.com/Events/MMS/2012/SD-B312
This wiki page contains lots of good links too: https://social.technet.microsoft.com/wiki/contents/articles/15608.system-center-service-manager-data-warehouse-and-reporting.aspx
Creating Reports Using Performance Point: https://blog.concurrency.com/infrastructure/creating-scsm-2012-reports-using-performancepoint/
